Center for Active Stewardship launches Splice, a tool for visualizing how a company’s greenhouse gas emissions change over time
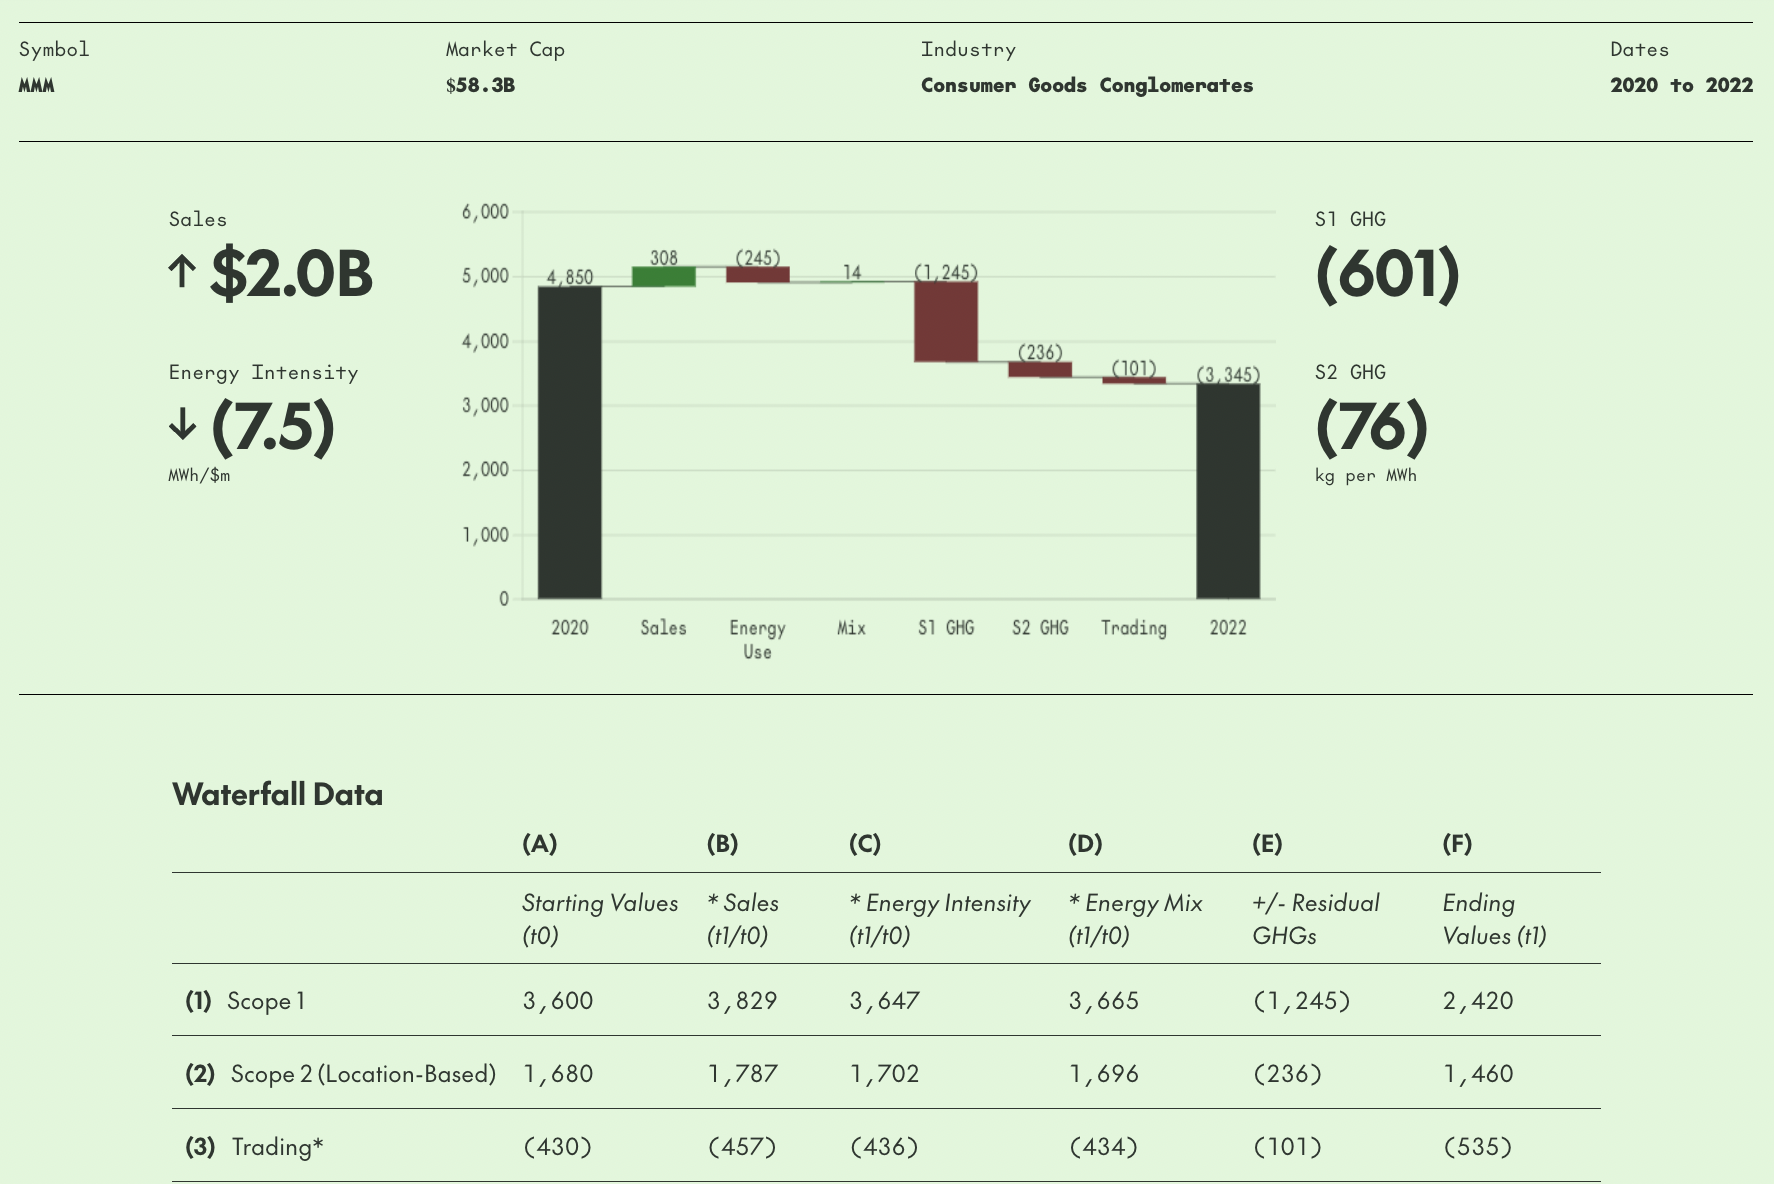
Today, JFI’s affiliate initiative, the Center for Active Stewardship (CAS), released an interactive tool for examining greenhouse gas emissions by company. Splice allows perusal of a variety of emissions drivers, allowing a more accurate scrutiny of how various companies are faring.
When it comes to emissions reporting, it’s important to be able to separate signal from noise. Initiatives to reduce emissions drive the most climate impact when they are based on durable moves that are under management’s control. On a year to year basis, emissions can go up or down for all kinds of reasons that are either transient, or not really under a company’s control.
Imagine a company dependent on hydropower in a drought-stricken region – its emissions might increase, as fossil fuel power plants fill the gap in electric generation, but not permanently, and not because of a decision made by the company. On the other hand, consider a company idling one of its plants because of a downturn in its end-markets. Emissions will decline, but they’ll go right back up as the market turns. Transient drivers like these can obscure longer-term trends in energy and emissions intensity.
Splice helps visualize what’s actually driving trends in emissions. Select a company, a start year, and an end year to see how (i) revenue trends, (ii) the energy intensity of revenue, (iii) the share of energy coming from the grid, (iv) the emissions intensity of grid electricity and fossil fuels used by the company, and (v) trading activity (for example, buying renewable energy credits).
Related

JFI’s Tuesday Climate Week Event in Bloomberg Green
Join us September 24 at 4pm.
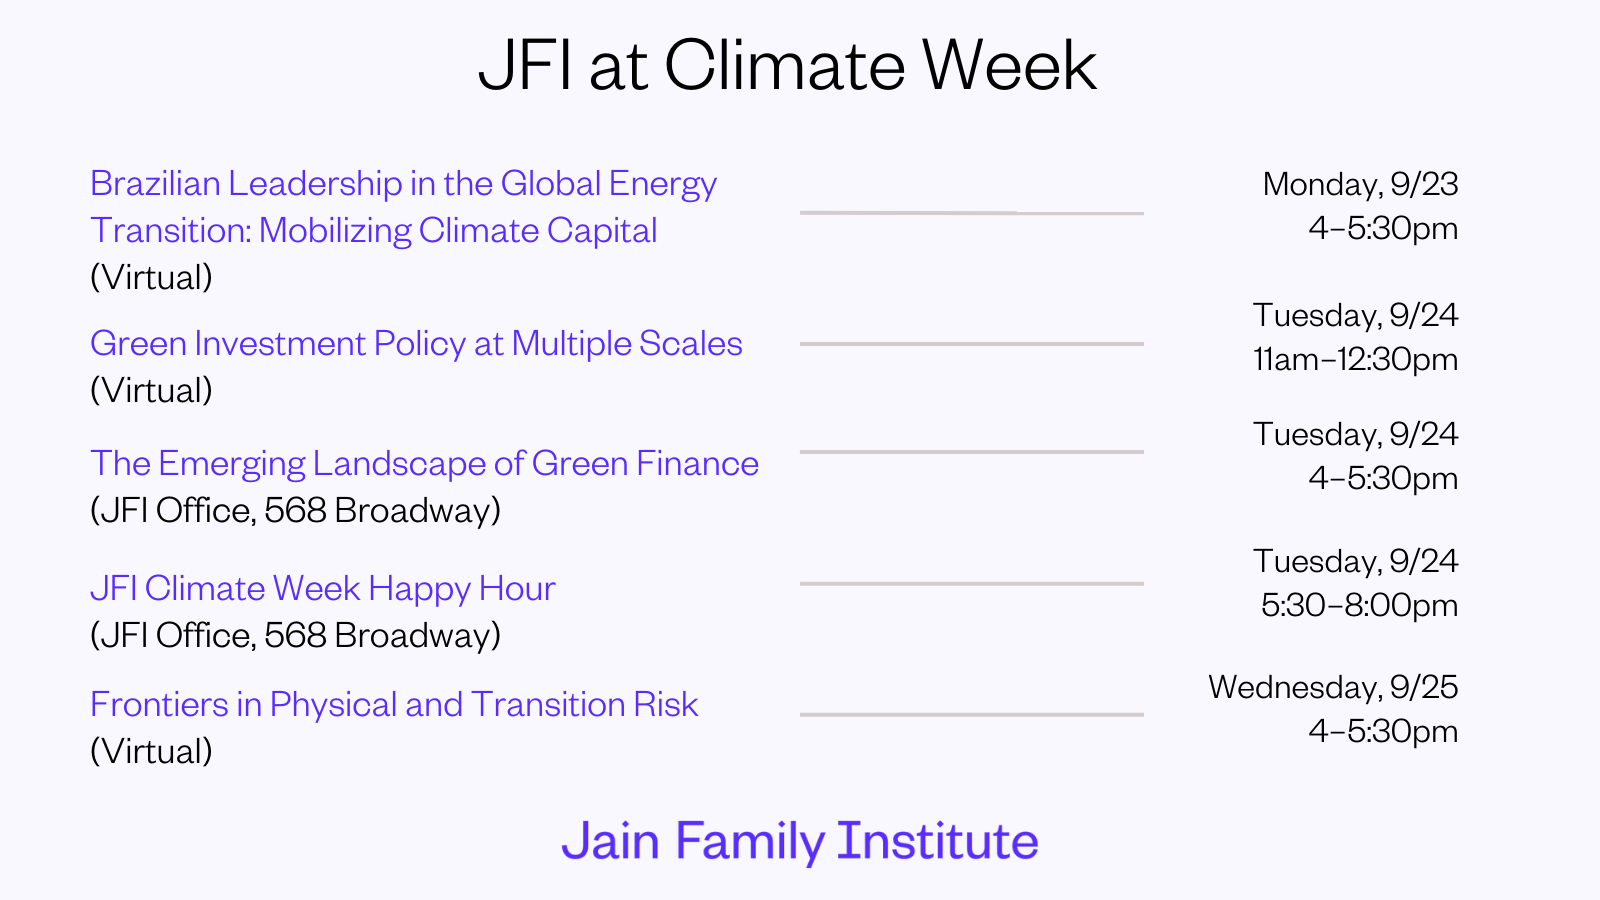
JFI at Climate Week
JFI and our affiliate initiative, the Center for Active Stewardship, are hosting a series of events during NYC Climate Week.

Climate Week with JFI, CAS, and CPE: In-person panel
How will the green transition be financed in the US?