Announcement and Summary: Declining Access, Rising Cost: The Geography of Higher Education Post-2008

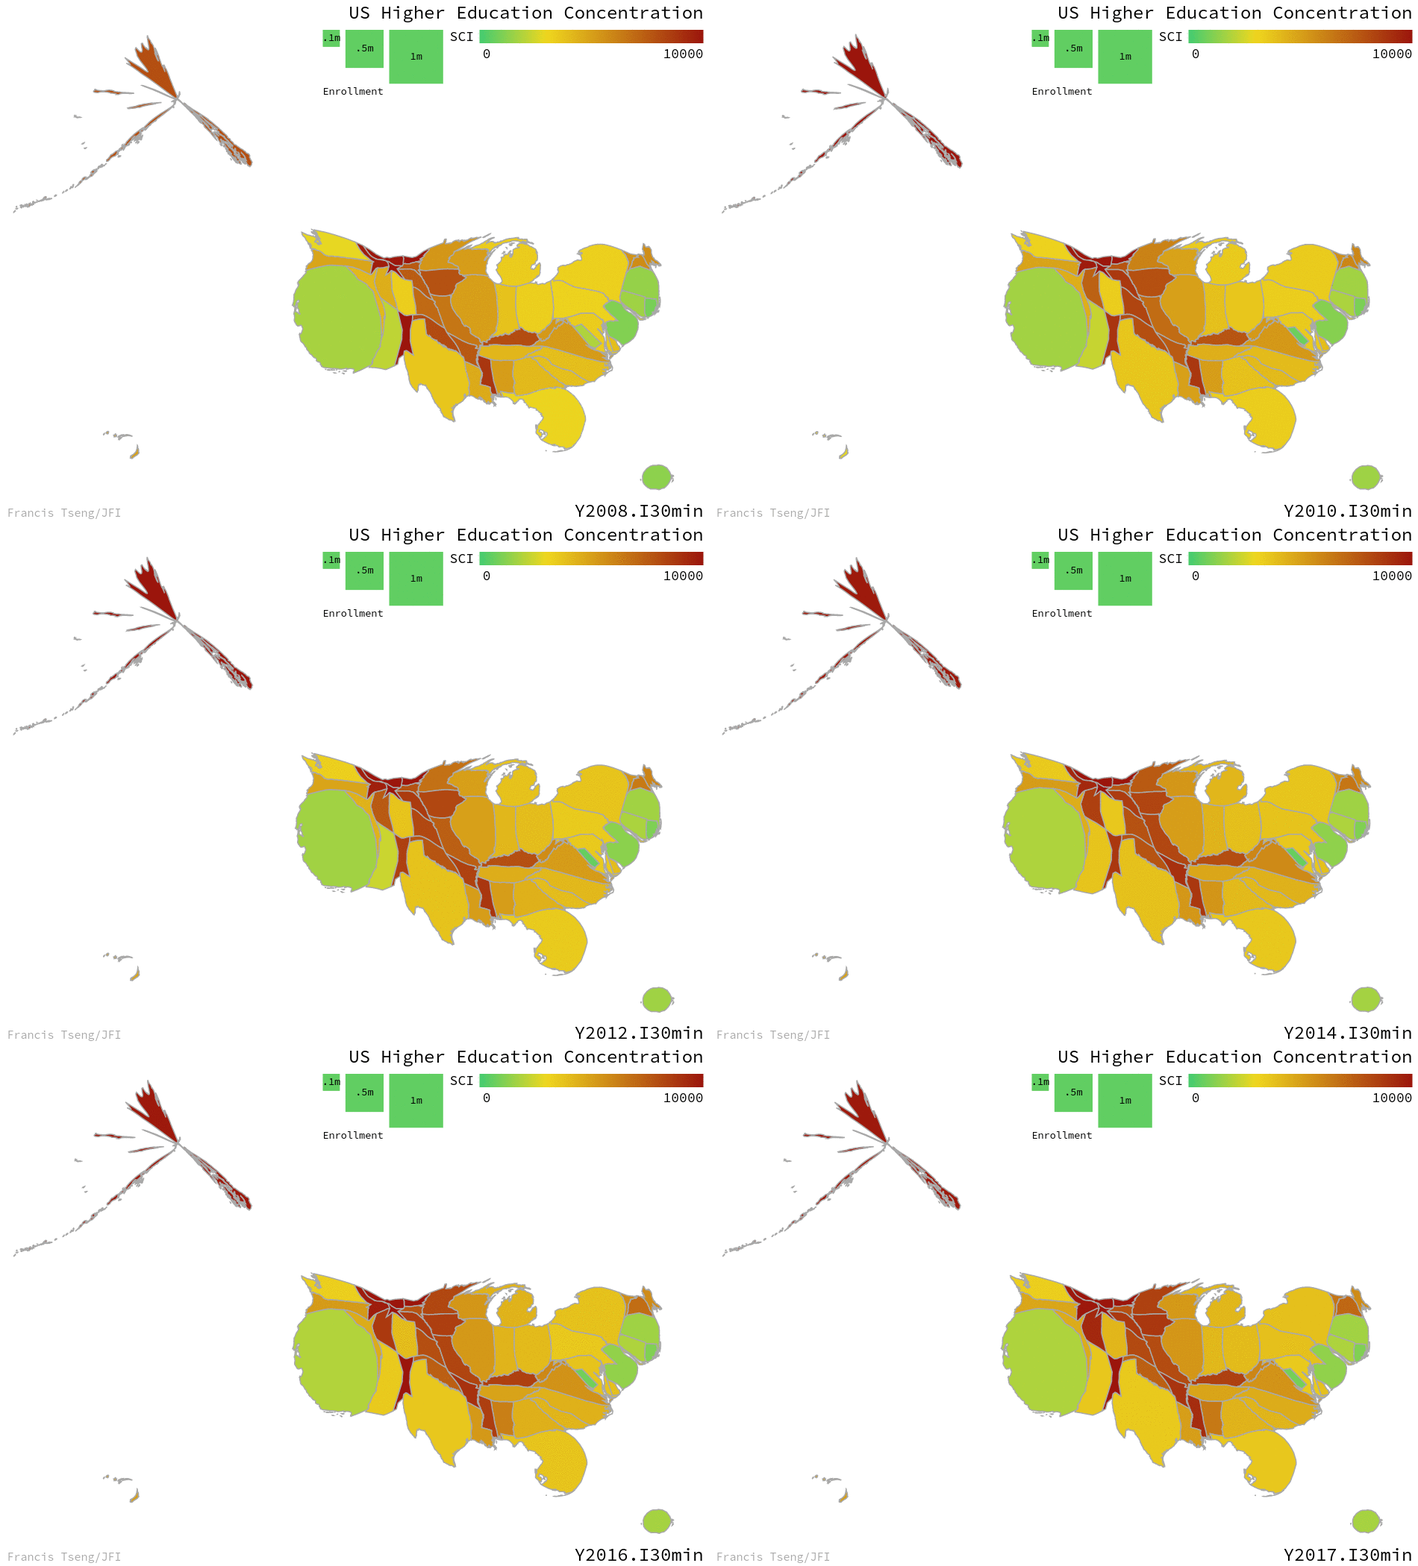
JFI’s Higher Education Finance research team has published the second installment in a multi-part research series on higher education access. Co-authored by Marshall Steinbaum and Laura Beamer, the report, “Declining Access, Rising Cost: The Geography of Higher Education Post 2008,” maps access to post-secondary institutions across the U.S. and U.S. Territories since the Great Recession, and examines the relationship between declining access and increases in the cost of attendance. The research has significant implications for existing inequalities in the higher education system–and the ways that these will be exacerbated by declining attendance and state budget cuts in the wake of Covid-19.
Some key findings and implications:
- As concentration in the higher ed market has increased, so has the cost—both in tuition and fees and in terms of the overall cost of attendance.
- Between 2008 and 2017, the aggregate count of higher education campuses has declined across school type, and zip codes considered education deserts have proliferated.
- 10.8 million people who had access to two 2-year higher education institutions in 2011 had access to one or no institutions by 2017.
- There is a strong positive relationship between broadband internet access and access to higher education institutions. These inequalities in access may compound with the anticipated transition to online learning in the coming months.
- The Rocky Mountains, Plains, and Southwest regions have seen the sharpest decline in access to higher education institutions.
- Richer zip codes generally have more available higher education institutions, but even the richest zip codes have seen declining access. This is likely to worsen with further market contraction.
- State funding cuts have produced a de facto privatization of higher ed institutions, with tuition and fees as well as cost of attendance increasing as the number of higher education institutions declines.
******************
Access here the write-up and the map, which shows a detailed, interactive picture of changes in access in every ZIP code between 2008 and 2017, according to varying commuting distances from post-secondary institutions, and across all school types—public and private (for- and non-profits).
Media contact: communications@jainfamilyinstitute.org.