Policy Microsimulations
The Impact of Families with No Income on an Expanded Child Tax Credit

By Jack Landry
Download the full PDF here for best reading experience.
Summary
When the expanded child tax credit was passed, parents out of the labor force were for the first time ever made eligible for the full value of the credit. Long called for by experts as key to reducing child poverty, this change has also been the program’s leading source of criticism.
This report presents new data to assess the relative impact of including parents with no earnings to the overall child tax credit expansion.1 Contact the author at jack.landry@jainfamilyinstitute.org. Ratik Asokan, Alex Jacobs, and Elaine Maag provided invaluable comments.
While this feature of the credit became a political lightning rod, the 2021 expanded CTC had several other important components. Low-income families with some earnings were newly provided the full value of the credit; previously, they were eligible for only a partial credit. The expansion also raised the value of the credit for all low- and middle-income families from $2,000 to $3,000 per child ($3,600 for children under six).
I estimate that only five percent of the total increase in benefits from the expanded CTC went to families out of the labor force with no income. Parents who, before the expansion, had some positive income, but not enough to receive the full credit, received forty-six percent of the benefit. Middle-income parents who already received full credit but benefited from the increase in the credit amount received forty-nine percent of the benefit.
These results provide essential context for understanding the CTC expansion. For instance, they suggest that the fervor of the debate over expanding the CTC to families without any income from work is misaligned with the scale of benefits going to this group. After all, ninety-five percent of the benefits of the expanded CTC went to families with positive income. The biggest beneficiaries of the CTC expansion were lower-income working parents, as more than half of the benefits went to families with some income, but less than $40,000.
The results also have important implications for the design of future possible CTC expansions. Since families with no income received a tiny portion of the expanded CTC, including this group is very inexpensive. I estimate that giving the current $2,000 CTC to families with no income would cost less than one percent of the full CTC expansion. However, the same fact implies that a CTC expansion with an earnings requirement could retain much of the expanded credit’s benefits to low-income families. For instance, if the expanded CTC had excluded families with zero income, it would have reduced the total benefits to families with incomes between $0 and $25,000 by just eleven percent. Extending benefits to families with no income is less important for poverty reduction than commonly thought.
To compute how much different income groups benefited from the expanded CTC, I used administrative IRS data on the incomes of families who claimed the credit on their 2021 tax return. This methodology is a deliberate departure from the predominant methodology for analyzing the impact of the expanded CTC with survey data. Relative to the IRS data, survey data dramatically overestimates the extent to which families with no income benefit, while significantly underestimating how much low-income families benefit. The discrepancy between survey data and IRS data likely results from a combination of some eligible families not receiving the credit and errors with survey-reported income.
Methodology: Combining Administrative IRS Data on Expanded CTC Claims With Microsimulation
This analysis aims to understand the relative importance of including families out of the labor force to the overall CTC expansion compared to families with low and moderate incomes.2 I use the term “out of the labor force” and “families with no income” to mean families without any reported income from paid employment. Sometimes technical discussions of labor force participation use “out of the labor force” to refer to individuals no longer actively looking for work. Many families with no reported income are likely looking for a job or are working in the informal economy. In prior work, we have used household survey data to answer this question, simulating the impact of different CTC designs while assuming all eligible families receive the credit. In this analysis, I use publicly available IRS administrative data to determine how much of the benefit of the expanded CTC went to different income groups, including those without income.
Administrative IRS data has several advantages. First, it provides the ground truth regarding which families received the benefit. This is the best way to assess the factual basis of criticism that the expanded CTC was primarily a no-strings-attached transfer payment to parents out of the labor force. Second, it accounts for the fact that some eligible families may not have received the credit.
In the absence of large-scale reforms to increase take-up, using real-world benefit receipt that accounts for incomplete take-up provides the best guidance for the impact of future policy changes. Without a plan to ensure all eligible families receive the benefit, analysis assuming perfect uptake has little utility. Third, due to potential issues with the survey data, there is considerable uncertainty as to what the CTC benefits distribution would look like with perfect take-up—a topic I discuss in more detail later in the report. Estimating the distribution of benefits for families who received the CTC has less potential for error.
The specific calculations work as follows. The administrative data comes from the IRS’s mid-November filing season statistics. This data provides the number of returns claiming the expanded CTC on their end-of-year 2021 tax return by adjusted gross income group. To compute the benefit that each income group received from the expanded CTC relative to the status-quo Tax Cuts and Jobs Act (TCJA) CTC, I use microsimulation to calculate the average CTC benefit for each group with and without the CTC expansion.3 When we estimate the distribution of benefits for the fully refundable TCJA CTC, we use microsimulation to compute the benefits by income group for that policy rather than the American Rescue Plan’s expanded CTC. The process is otherwise the same. Multiplying the number of returns claiming the CTC by income group (from administrative IRS data) by the benefit per return (estimated from microsimulation) gives the overall benefit by income group. Additional details are provided in the appendix.
I focus on the share of benefits received rather than the number of children receiving benefits by each income group. As lower-income families receive a larger increase in benefits than middle-income families, simply presenting the number of children would understate the importance of the CTC expansion to the lowest-income families.
Calculating the share of benefits by income group has some important drawbacks. Fundamentally, it is a very coarse measure. Traditional analysis survey data can provide richer impact data, like the effect on poverty and benefits by race and ethnicity. While it is possible to combine administrative and survey data to estimate these metrics, this kind of exercise would require an additional layer of assumptions, which I avoid by limiting the analysis to a simple breakdown of the expanded CTC benefits by income group. I discuss the more technical drawbacks of the administrative IRS data in the appendix.
Results: Share of Expanded Child Tax Credit Benefits By Income Group
I begin by breaking down the benefit of the expanded CTC into three groups: 1) families with no income; 2) families with some income but not enough to receive the full value of the status-quo credit; and 3) middle-income families who receive the full credit, but benefited from an increase in its value.4 The appendix displays a graph breaking down the expanded vs. status-quo benefit by income level. The “percentage of benefit” refers to the portion of the total increase in the CTC that went to each group.
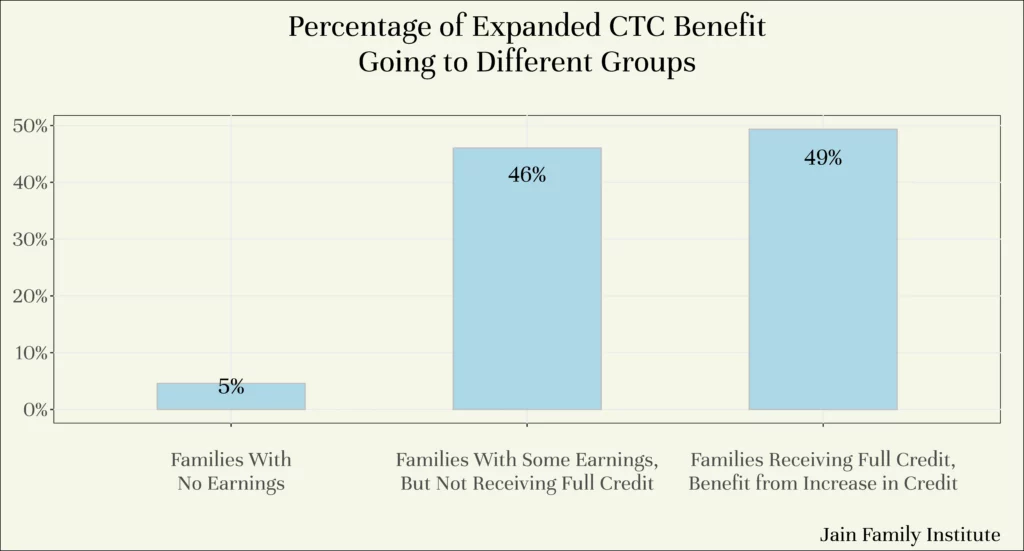
The graph shows that families with no earnings received only 5 percent of the total increase in benefits. Families with positive income but not enough to receive the full CTC received 46 percent of the benefit. And families who were receiving the full credit but benefited from its increase in value received 49 percent of the benefit.
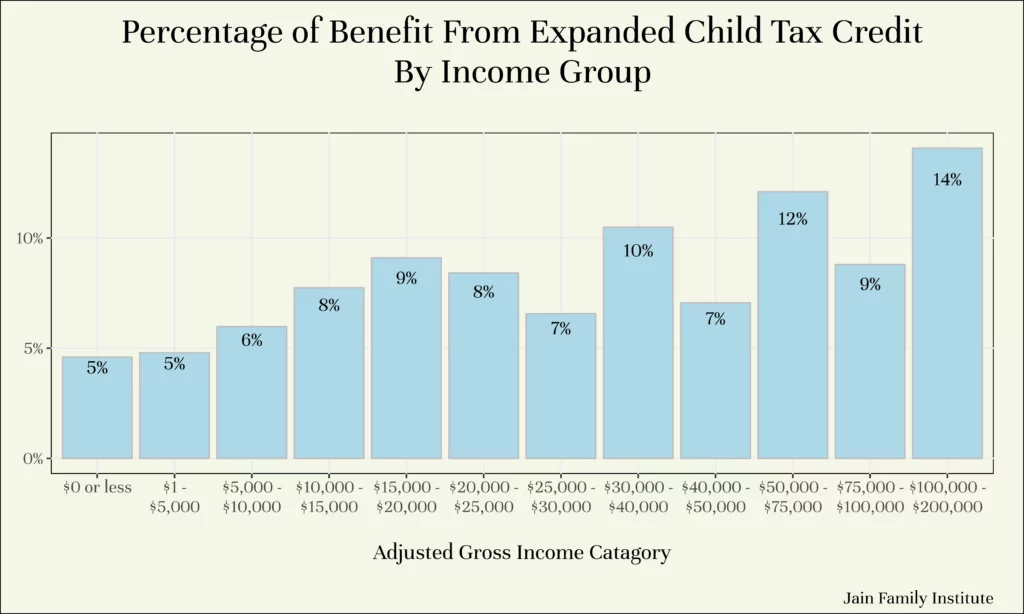
The next graph breaks down the benefits of the expanded CTC by income group, which gives a more granular portrait of the incomes of families who benefited from the expanded CTC. For instance, it shows that over half the benefit went to families with positive income less than $40,000. Families with incomes between $100,000-$200,000 received just 14 percent of the benefit.5 Families with incomes above $200,000 did benefit via the new inclusion of seventeen-year-olds, but the overall impact was less than one percent of the total benefits of the expanded CTC, so it is not shown on the graph.
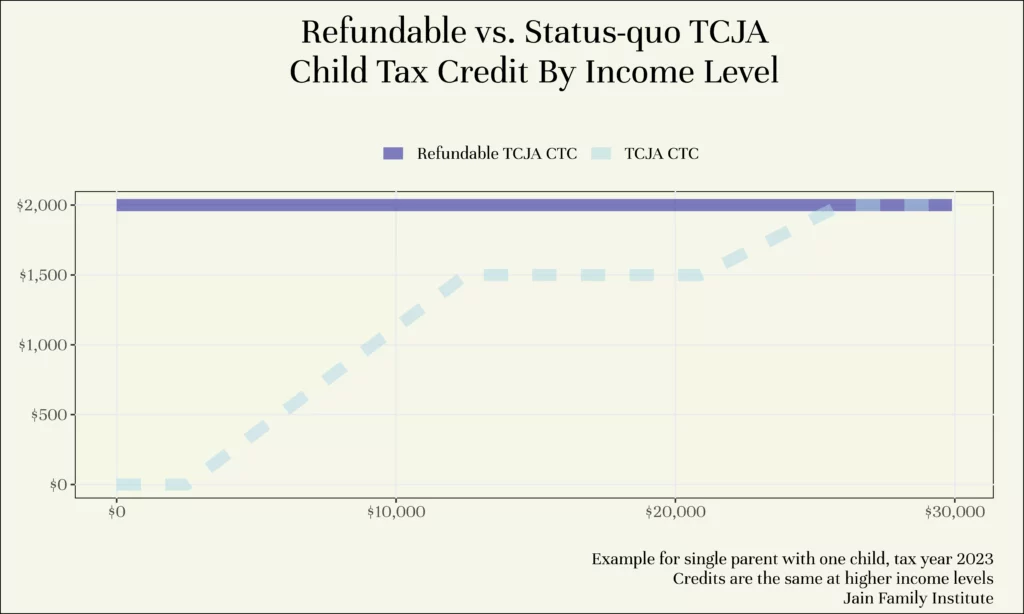
Next, I show the share of benefits that would accrue to each income group if the status-quo TCJA CTC was made fully refundable, with the full $2,000 credit going to all low-income families, including those without income.6 The appendix displays a graph breaking down the fully refundable vs. status-quo benefit by income level. This analysis adjusts the benefits per group to reflect a fully refundable TCJA while holding the filing population constant. A fully refundable TCJA CTC would concentrate benefits to lower-income families by eliminating the parts of the ARPA expansion that increased benefits for middle and high-income families (increasing the credit’s value for those s already receiving the full amount and making seventeen-year-olds eligible). It would solely increase benefits by eliminating the CTC’s slow phase-in with earnings. The analysis tests how much families without income would benefit from receiving the full CTC relative to those with low incomes who currently receive a partial credit.

Though a fully refundable TCJA CTC would only increase benefits to families with either low or no income, the vast majority of benefits from the program would still flow to families with positive income. Specifically, I estimate 12 percent of the benefits would accrue to families with $0 or less adjusted gross income. This result demonstrates that filling in the phase-in of the TCJA CTC would primarily benefit families who do not earn enough to receive the full TCJA credit, but are engaged in the paid labor market.
Comparing Estimates Using IRS Data to Estimates Using Survey Data Alone
Research that simulates the impact of the expanded CTC usually relies solely on survey data (including our own prior work). Survey data paints a starkly different portrait of the importance of families with no income in the CTC expansion. The graph below compares the estimated increase in benefits calculated by using IRS data on actual credit receipt versus simulating returns with survey data. The survey-based methodology estimates that 20 percent of the expansion went to families with no income, four times greater than the IRS data estimate. However, this does not imply that survey data overstates the share of the benefit going to lower-income families. In fact, the IRS data shows that two-thirds of the benefit of the CTC expansion went to parents with incomes below $50,000, about 10 percent higher than the estimate based on survey data. The main difference between the survey-based estimate and the IRS data estimate is that IRS data shows that low-income families with some positive income received the bulk of the benefit from the expanded CTC, while the survey data shows that families with no income are far more important.

Numerous reports and analyses of the CTC rely on survey data.7 An incomplete list of institutions analyzing the CTC with survey data includes the Congressional Research Service, the R Street Institute, the Columbia Center for the Study of Social Policy, the Niskanen Center, the Hamilton Project, the Urban Institute, the American Enterprise Institute, the Cato Institute, and numerous academic analyses, including the National Academy of Science’s Roadmap To Reducing Child Poverty. Even as their methodologies differ, any use of survey data will likely overstate the importance of families with no income to the CTC expansion if it is relevant to their analysis.8 Some of the discrepancies between survey data and IRS administrative data could stem from some eligible families not receiving the credit, which I discuss in more detail in the next section. Some analysts adjust simulations of the impact of the expanded CTC to account for incomplete take-up. While this may better match IRS records than assuming perfect uptake, it could not account for how survey data underestimates the number of low-income families benefiting from the expansion. To give one a concrete example, Columbia University’s Center for the Study of Social Policy recently analyzed the characteristics of children left out of the TCJA CTC due to insufficient earnings. They reported that of these children, 35 percent do not receive any credit because their income is less than $2,500, based on survey data on income earned in 2022. Using my methodology with administrative IRS data on tax returns based on 2021 income, I estimate that just 9 percent of children who received the ARPA expanded CTC would not have received the TCJA CTC.9 Neither my estimate nor the Columbia estimate include the seventeen-year-olds newly made eligible by the ARPA CTC. Notably, the Brookings-Urban Tax Policy Center similarly finds ten percent of children not receiving the full TCJA CTC are not receiving any credit because their parents have less than $2,500 in earnings. Their methodology also makes use of administrative IRS data.
Importantly, I do not find that the total number of children excluded from the full TCJA CTC is exaggerated by survey data. In fact, my methodology using IRS data estimates that twenty-two million children who received the expanded CTC would not receive the full TCJA CTC–four million more children than the Columbia estimate.10 The Columbia estimates are based on 2022 income data while I use 2021 income data–the growth of incomes at the bottom of the distribution between 2021 and 2022 likely reduced the number of children who are not receiving the full TCJA CTC in 2022. In other words, survey data and IRS data agree that a large number of children are left out of the status-quo TCJA CTC. However, IRS data show that families with positive income claim the vast majority of these children (almost 95 percent).
Discussion: Why Are So Few Parents Claiming the Expanded CTC With No Income, and What Are the Policy Implications?
There are several reasons why a small fraction of the benefit of the expanded CTC went to parents without income. First, there could be a significant take-up problem among this group. Before COVID-related economic impact payments and the expanded CTC, , a family without income would see no benefit to filing a tax return–nor indeed was there an obligation to do so. While there was a significant effort to inform families about the credit, this may not have overcome years of conditioning tax benefits on working. Other parents may have heard about the credit, but did not file because they want to avoid contact with the IRS or because they find tax filing a confusing process. Survey-based microsimulation tends to assume all eligible children receive the credit, so incomplete take-up could explain the difference between the survey-based estimates and my estimates based on IRS data.
However, there are other explanations besides incomplete take-up for why only a small share of benefits went to parents without reported income. While survey data suggests that there are a large number of families with no taxable income, there is evidence that some households who made a small income misreport they did not earn any money during the year on a survey. This suggests a second possibility, which is that relatively few families claimed the CTC with $0 or less AGI because relatively few such families really exist. Third, children whose parent(s) have no income may be claimed by other people with earnings. In many cases, this reflects complicated family circumstances, where the money likely ultimately helps support the children claimed.
It is beyond the scope of this report to review the evidence for each explanation in detail. All three likely play some role, but it is unclear how much explanatory power they have relative to one another. This is an extremely important topic for future research. For instance, if take-up among families with no income is as low as the discrepancy between survey and IRS data implies, it bolsters the case for more far-reaching administrative reforms to the CTC, such as administering a child allowance through the Social Security Administration. However, these kinds of administrative reforms are complex, longer-term endeavors unlikely to be addressed in a bipartisan tax-extender deal.
Regardless of the underlying reasons, the low share of benefits currently reaching families with no income has important short-term policy implications. First, the small share of benefits received by parents with no income provides important context for understanding the impact of the expanded CTC. While there is a fierce political debate over the merits of giving the credit to parents without any income, this group represents a small fraction of beneficiaries. This rebuffs claims that the CTC expansion was primarily intended for parents out of the workforce, similar to pre-reform cash welfare. For instance, some critics lambasted the expanded CTC as a new welfare program that was part of a “war on work.” While the expanded CTC did uniquely make families out of the labor force eligible for benefits, ninety-five percent of the benefits went to families with positive income.
Second, the results show that providing benefits to parents with no income has a minimal additional cost. Many critics of the CTC expansion cited its high cost–roughly $100 billion for the ARPA expansion. While this represents a substantial fiscal commitment, expanding benefits to families with no income is much less expensive. For instance, Joint Committee on Taxation estimates show that making the $2,000 per child status-quo CTC fully refundable would cost approximately eight billion dollars. My estimates imply that of that cost, less than one billion would go to families without income. In other words, providing the current $2,000 per child credit to families without income costs less than one percent of the full CTC expansion.
Third, the results have important implications for estimating the impact of a future CTC expansion that retained an earnings requirement. Since very few families out of the labor force claimed the expanded CTC, an expansion that excluded this group could still increase benefits for the vast majority of low-income families excluded from full credit under current rules due to insufficient earnings. For instance, if the expanded CTC excluded families with no income, it would reduce the total benefits to families with incomes below $25,000 by just 11 percent.11 California’s Young Child Tax Credit (adopted in 2019) had this kind of earnings requirement where families with any earned income received the full credit until it was made fully refundable in 2022. If the current $2,000 per child CTC were reformed to have an FSA 2.0 style phase-in that does not provide any benefit to families without income, but gives the full CTC at $10,000 of income, it would provide about 75 percent of the total benefits of a fully refundable $2,000 CTC using my methodology based on 2021 filing patterns.12 FSA 2.0 is a CTC reform proposal sponsored by Republican Senators Mitt Romney, Richard Burr (now retired), and Steve Daines. It proposed phasing-in the CTC so families with no income were not eligible, families with $10,000 of income got the full credit, and families with incomes between these points got a fraction of the credit they were eligible for proportionate to their earnings. For instance, a family with one child eligible for a maximum credit of $2,000 but who only had $5,000 in earnings would receive $1,000, or 50% of what they were eligible for.
The second two implications involve predictions about the impact of theoretical future expansions. In doing so, I assume a future refundable CTC would have similar take-up among families without income as in 2021. Even if the dearth of families claiming the expanded CTC without income reflects a significant take-up problem, it is doubtful that take-up will substantially improve in the near term. While efforts to make filing accessible had some significant hiccups, low-income families could eventually claim the credit through a simple, bilingual, mobile-friendly non-filer portal that did not require recipients to input detailed income information.13 This portal was only available after the filing deadline for receiving the second half of CTC payments. However, usage of the non-filer portal for receiving advanced payments was relatively low. Significant further progress will likely require long-term investment.14For instance, some analysts have suggested administering a child allowance through the Social Security Administration would bolster take-up, but this would likely be a multi-year project. This means that filing patterns in 2021 should be a good predictor of filing patterns if a fully refundable CTC were implemented in the near future, and, therefore, that families without income would accrue a small share of the total benefits.15 One factor that will increase the share of benefits going to families without earnings is inflation and real wage increases concentrated at the bottom of the income distribution. As low-income families increase their nominal earnings, they are less likely to receive a partial CTC. This dynamic will reduce the total number of families receiving a partial CTC, but increase the relative importance of families without earnings as a share of families not receiving the full CTC.
What does the low share of benefits accruing to parents with no income imply for the anti-poverty impact of the expanded CTC? The answer depends on whether the lack of claims stems from incomplete take-up among this group or the paucity of families with children without earnings. A take-up problem implies that prominent estimates of the poverty reduction from the expanded CTC are overstated, as many families below the poverty line are not receiving the expanded credit. The data used for the Census Bureau’s official supplemental poverty measure assumes all families eligible for the expanded CTC receive it.16 Implicitly, the Census’s Burueu’s measure even assumes some ineligible families receive the CTC because it does not account for the fact that children with ITINs are not eligible for the credit. On the other hand, if survey data overstates the true share of families without income, or these families receive the money via other family members with earnings who claim the credit on their behalf, the estimated anti-poverty impact should be roughly accurate.17 The same survey data that may overstate the share of parents with no income is used to estimate the anti-poverty impact of the expanded CTC, so it may seem paradoxical that if it is wrong about the share of families with no income, it is correct about the poverty reduction. However, families who misreport having no income likely have a low income that still puts them below the poverty line. The best estimate of survey income misreporting using linked administrative records finds that correcting the income data does not significantly change the child poverty rate, which suggests that any parents misreporting having no income still have incomes below the poverty line.
What about the anti-poverty impact of a fully refundable CTC compared to an expansion that phases-in with income very quickly but excludes families without income? This analysis avoids explicit poverty calculations since they involve many additional assumptions. However, the difference in the anti-poverty impact of either policy would likely be relatively small. Since the expanded CTC delivered a small share of benefits to families with no income, excluding this group will not radically change the anti-poverty impact. Many low-income families that receive a partial TCJA CTC and would receive a full CTC with a faster phase-in are below the poverty line. In short, policymakers do not need to focus exclusively on families with no cash income to reduce child poverty.
While families without income receive a small share of the total benefit from the expanded or fully refundable CTC, there are still strong arguments for a CTC to include all low-income families, not just those with earnings. An incomplete list is as follows. First, the child tax credit should support children, not force parents into the paid labor market. An earnings requirement ignores that families with children out of the labor force often have significant barriers to paid work, like caring for young children (which itself is a form of work). Second, concerns that an unconditional benefit disincentives work are grossly exaggerated. The research base used to predict that families will leave the workforce does not withstand scrutiny and relies on extrapolating fundamentally different policies than an expanded CTC. Third, while the benefits to families without income were relatively small in 2021, they could be substantially higher in a future recession when more families are out of work. Work-tested benefits are pro-cyclical, withdrawing support during an economic downturn when families need them most. Fourth, while families without income may receive a small share of the total benefit of the expanded CTC, they are among the most in need of additional cash assistance. Families with cash incomes below $10,000, who may receive a partial benefit even with a fast phase-in, are far more likely to be in deep poverty than those with somewhat higher incomes who do not receive the full TCJA CTC.
Importantly, aspects of a fully refundable CTC benefit families in the labor force, not just those without earnings. First, full refundability ensures the workability of advanced monthly payments, a mode of receipt that helps stabilize incomes over the course of a year and is preferred by many parents. If the CTC is made conditional on income, and advanced payments are based on prior income, a parent who loses their job may be forced to repay their credit while facing a large decrease in their income. This scenario would obviously be untenable absent some kind of carve-out for these situations.18 A safe harbor provision could ensure anyone overpaid because their income decreased did not have to repay the credit. Second, full refundability may enable more low-income working families to claim the credit. Making the credit unconditional on income allows for a much easier filing process via a non-filer portal. While primarily set up so families without earnings could receive the benefit without the burden of a full tax return, the non-filer portal also enables families with a small income to claim the credit without detailed income reporting.19 Anyone with an income below the filing threshold–$18,800-$25,000 for most families with children in 2021–was eligible to use the portal. While anyone using the non-filer portal is recorded as having $0 income in the IRS administrative data,20 Confirmed via personal correspondence with IRS Statistics of Income staff. a significant share may have had some income but found the non-filer option easier. When Code for America implemented an option to file a full return and receive the federal EITC in their simplified portal, many users tried to input income information, but just 0.2 percent of families successfully did so.
Conclusion
While the expanded CTC made parents out of the workforce eligible for the credit for the first time, my analysis of IRS administrative data shows that only five percent of the benefit went to this group. This contrasts with much of the prior analysis of the expanded CTC, which relied on simulating the impact of the CTC with survey data, mistakenly showing that families without income received a much larger share of the benefit. IRS data shows that the majority of the benefit of the expanded CTC went to families with a positive income, but below $40,000.
These results provide essential context for understanding the effects of the CTC expansion. Contrary to what some critics allege, the CTC was not the reincarnation of pre-reform cash welfare where most benefits went to families out of the labor force. Expanding benefits to parents without income accounted for a tiny portion of the cost of expanding the CTC.
These results also have important implications for future CTC expansions. Much commentary about the CTC insists that full refundability is critical to poverty reduction. While it is true that full refundability will always result in the most poverty reduction, the low share of benefits going to families without income implies it is less crucial than commonly believed to be. A future expansion that preserved an earnings requirement but gave the full benefit to families with earnings or phased in very quickly would deliver the bulk of the benefits of a fully refundable expansion for low-income families.
Appendix
Child Tax Credit Structure

Additional Methodological Details
The specific IRS data used is the 2022 “Mid-November Filing Season Statistics by AGI,” which provides “data from the population of all Forms 1040 processed by the IRS on or before week 47 of the calendar year” for tax year 2021. These statistics only include end of year returns (where half the CTC was paid out to most families), not advanced payments of the CTC made in 2021.
Some families without income may have only received advanced payments, not the end-of-year CTC. Families may not have been aware that they needed to submit a 2021 return to receive the rest of their CTC, and during filing season, there was no simplified return or “non-filer tool” option, which made claiming more difficult.
However, IRS administrative statistics on the incomes of families claiming the advanced credit show a much smaller share of families claiming the credit with $0 AGI than the end-of-year statistics. This is likely in part because advanced payments could be based on tax returns in 2020 or 2019. Many low-income families may have $0 income in one year and not file a tax return, but positive income in another year when they do file. Advanced payments would be based on the higher income year when they do file. End of year payments were only based on 2021 income, so these statistics do not have the bias of removing from the $0 income group parents who had positive income in prior years.
To simulate the average CTC benefit by income group, I use a microsimulation analysis based on Current Population Survey-Annual Social and Economic Supplement data from 2023. I compute the average CTC benefit among families with dependent children under the expanded CTC rules and the TCJA rules.
In general, this process has fairly limited potential for error. The average CTC benefit in each income band will vary based on income and number of children. For instance, calculations could be slightly off if average income computed among CTC filers with incomes between $5,000 and $10,000 was $8,000 when the true average income in this group was $7,000, but this would have a minor impact on the average CTC for this group.
In addition to breaking down the benefits by income group, I break down benefits by grouping recipients into three categories: 1) those without income; 2) those whose positive income is not enough to receive the full TCJA CTC; 3) those with moderate incomes who received the full TCJA CTC, but still benefited from the increase in credit level. This is mostly an exercise in breaking down the share of benefits into three different income groups: low, medium, and high. However, there is no set income level at which parents receive the full TCJA CTC–families with more children must have higher earnings to receive the full credit. I estimate what fraction of filers receive the full compared to partial credit in each income group, and then divide the share of benefit in a given income group between categories appropriately.
It is also important to note that the adjusted gross income bins that I rely on in the administrative IRS data do not perfectly measure the underlying concepts around income I am interested in. In the context of identifying families with $0 income, the $0 or less group includes high-wealth families who are declaring large losses on capital gains or business income. Some families in the $0 or less group even have wage earnings that are offset by negative income in other categories. Since the IRS data is aggregated, I cannot differentiate between these cases and families who claim the CTC and have no other source of income. Similarly, not all families with a positive adjusted gross income are actively engaged in the labor force–some get by solely on investment income or unemployment insurance from working in the prior year.
While the administrative IRS data also shows the total benefits by income group, it does not include advanced payments. Since it only shows end-of-the-year payments, these numbers may not provide a good indicator of the total benefit of the expanded CTC, if some income groups disproportionately opt out of advanced payments or miss out on advanced payments and receive the entire CTC benefit as a lump sum at tax time. Using microsimulation to estimate the share of benefits of the expanded CTC by income group avoids this potential bias.
The other benefit of using microsimulation to estimate the average benefit by income group is that it ensures that we calculate the benefits of the expanded CTC, the TCJA CTC, and other potential reforms using the same source. There is no administrative IRS record of how much families would have been paid holding filing constant but under different tax rules.
One factor not accounted for in my approach are the “safe harbor” provisions for families that received advanced CTC payments that were too large. Since advanced payments were based on 2020 or 2019 tax returns but paid during the last half of 2021, some families received larger payments than they were eligible for because their circumstances changed. Lower-income families that were overpaid because they could claim fewer children than their advanced payments were based on were allowed to keep a certain portion of the overpayment.
It is unclear how much the safe harbor provision increased total CTC payments. However, the amount is likely fairly limited, because advanced payments only provided half of the total CTC parents were eligible for. For instance, if a family was provided advanced payments for two eligible children, but only ended up claiming one, they would not have been overpaid overall, as advanced payments were only 50 percent of their total payments.